Everyone talks about productivity. Since AI arrived in development shops, the promise of moving faster is everywhere. Yet a simple question often goes unanswered: how do you know?
Without a reliable measurement, "we're moving faster" is a belief, not a fact. We wanted to get out of that fog for ourselves, before talking about it to anyone. Here's what the exercise taught us about the real value of a metric.
Moving fast, and proving it
Velocity has become a selling point. Time savings, shorter cycles, teams augmented by AI are all promised. The intention is legitimate.
The problem isn't the promise. It's that it often rests on an impression. A team feels faster, one month seems better than another. Gut feeling isn't data.
For an executive, this confusion is costly. You set goals based on hunches. You arbitrate a budget with no comparable baseline, and you mistake a good month for a trend.
Turning scattered figures into a trend
Project tracking tools are not short on charts. They give values, sometimes useful ones. But comparing one month to another remains surprisingly difficult there.
Some data doesn't export easily. Other data can't be cross-referenced between applications. You end up with isolated figures, never a trajectory.
Seeing a value isn't the same as following a trend. The former describes a moment. The latter sheds light on a direction, and that's what helps you decide.
Honest data, even incomplete
Faced with an incomplete dashboard, the temptation is to fill in the gaps. You estimate, you round, you fill an empty box to reassure. It's the costliest mistake.
An invented figure doesn't stay neutral. It steers a decision, sets a goal, commits a budget. A false indicator is more dangerous than a missing one, because it inspires false confidence.
We decided the opposite. When a measurement isn't attainable, it stays blank. An empty indicator is honest information, not a weakness to hide.
The three principles we hold
To measure our own development flow, we built an internal tool. Its purpose isn't to impress. It's to turn scattered data into indicators comparable over time.
Three principles govern it, and they matter more than the tool itself.
- Blank rather than invented. If an indicator can't be calculated, it stays null. No value is fabricated to look good.
- Reproducible calculation. The same month, recalculated, gives the same result. A figure is only worth something if it can be replayed identically.
- Comparison over time. We don't look at an isolated value, but at its distribution month after month. That's what reveals a trend.
In practice, the tool tracks a few simple flow indicators: the time between the start and end of a task, its actual processing time, the time spent in review, and the time it stayed blocked.
Aggregated every month, these indicators show where work waits, where it moves forward, where it gets stuck. Not a judgment, a source of insight.
The stack, in full transparency
Since we preach transparency, we might as well describe the building blocks. Nothing exotic: proven components, assembled cleanly, rather than a fashionable stack.
- A PostgreSQL database as the single foundation, where the raw data and derived indicators live.
- An ingestion connector that syncs tickets from the project tracking tool (Jira), either in full or incremental refresh.
- A deterministic calculation engine that reconstructs the timeline of each task and derives the flow indicators from it.
- A read-only JSON REST API, protected by an authentication token.
- Grafana dashboards, connected read-only, to track trends month after month.
- A scheduled run at night, refreshing the data with no manual intervention.
The guiding choice isn't technological. It's keeping each building block simple, replaceable and under control, so the tool stays manageable and reversible.
The definition makes the indicator
Rigor doesn't stop at the calculation. An indicator depends entirely on its definition. Change the rule without saying so, and the measurement becomes wrong without warning.
This is the classic trap of managing by the numbers. A precise-looking dashboard can rest on fuzzy definitions. The displayed precision then masks real fragility.
Hence a simple discipline: define each indicator explicitly, and hold that definition over time. Otherwise, the monthly comparison compares different things.
The first two months of testing on a given project, read with caution
With the method in place, here's our first reading. Over our first two months of measurement (April and May 2026), an early signal is taking shape.
Our median cycle time, the time between the start and end of a task, goes from 2.8 to 2.17 days.
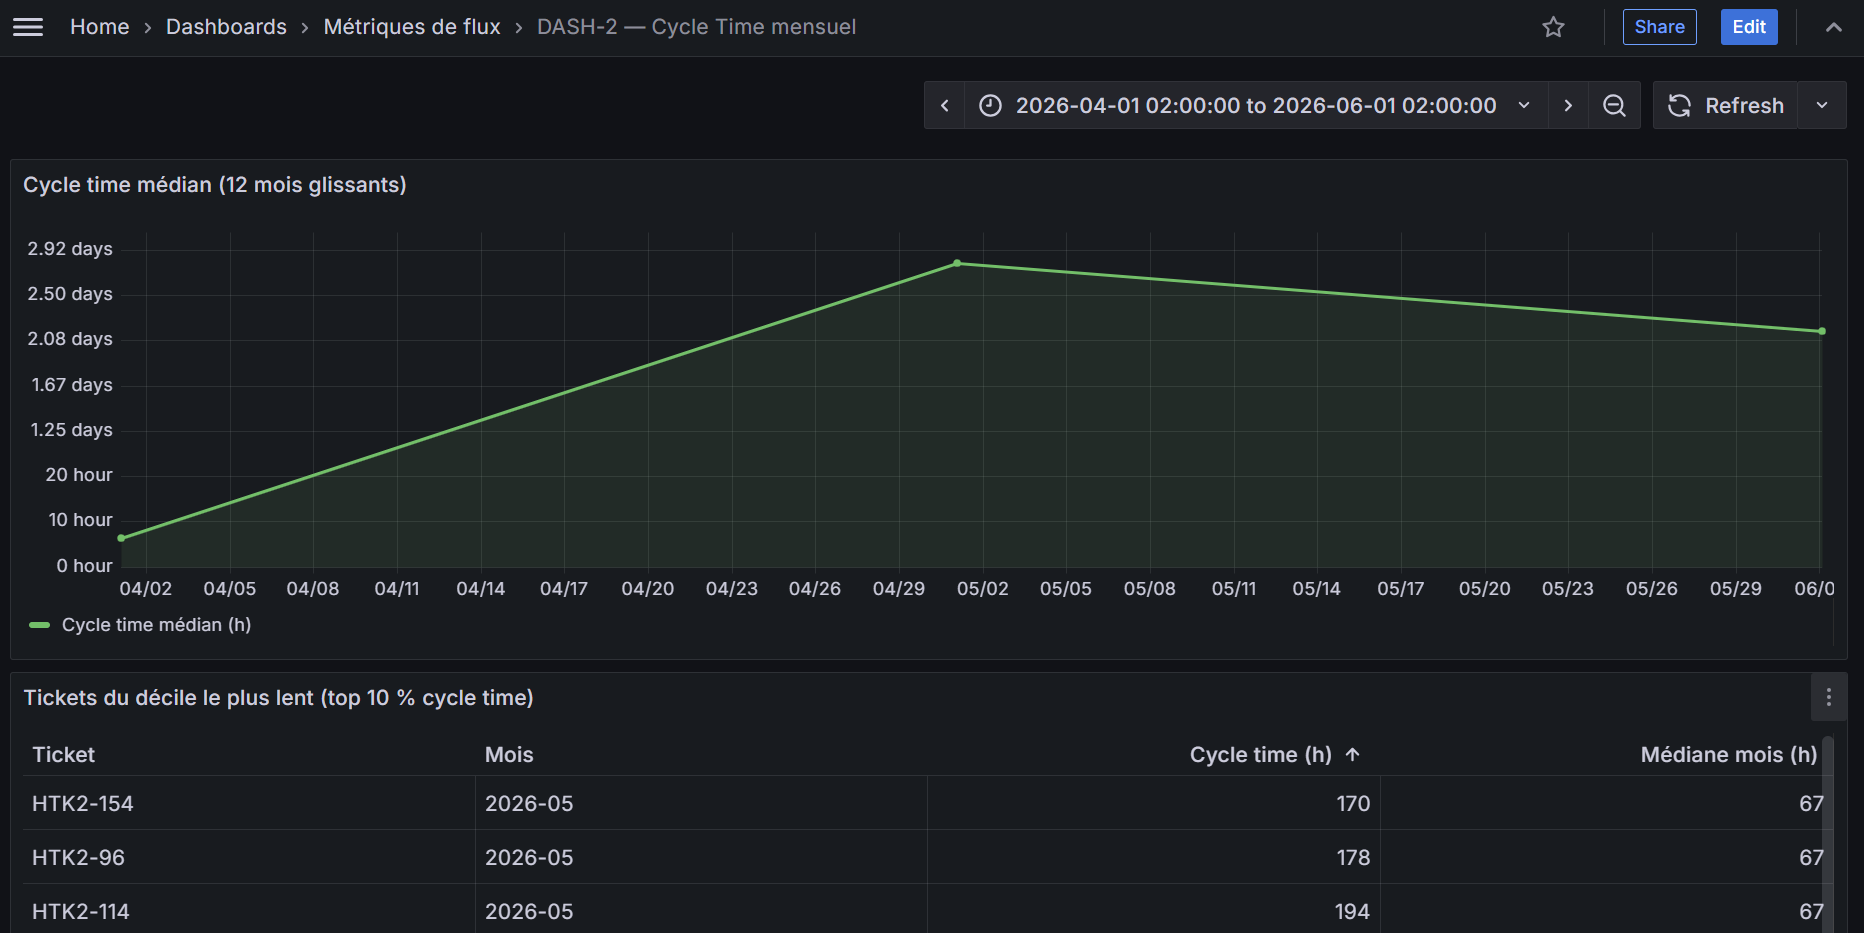
Our internal dashboard (Grafana): median cycle time, month after month.
Two months don't make a trend. So we hold ourselves to our own rule. The drop is real over the period, but short: a signal to confirm, not a proof to brandish.
Nor do we attribute it to a single factor. A shorter cycle time can come from tooling, from organization, or from a more favorable month. That's exactly why we watch it over time before drawing conclusions.
Measuring to inform a decision
A measurement tool calls for two safeguards. The first: a first version remains a first view. Ours covers a few indicators, not everything. We say so, instead of overselling a complete picture.
The second safeguard is human. A flow indicator sheds light on a process, it doesn't grade people. Confusing the two damages trust and permanently distorts the measurements.
These precautions decide whether a dashboard serves to understand or to monitor. We chose to understand.
So the real question isn't which measurement tool to adopt. It's knowing under what conditions a figure deserves to be used to decide: a clear definition, a reproducible calculation, and the honesty of an accepted blank when data is missing.
We started by measuring our own shop before talking about anyone else's. It's a good test for any partner: does it ask you to trust its figures, or does it give you a way to verify them?
If this idea speaks to you, we can deploy it at your place
We built this tool for ourselves. This kind of instrumentation transposes easily to another shop. If this topic speaks to you, get in touch: we'll talk about it concretely, at your own pace.